Analyzing your map reading technique – Automagically!
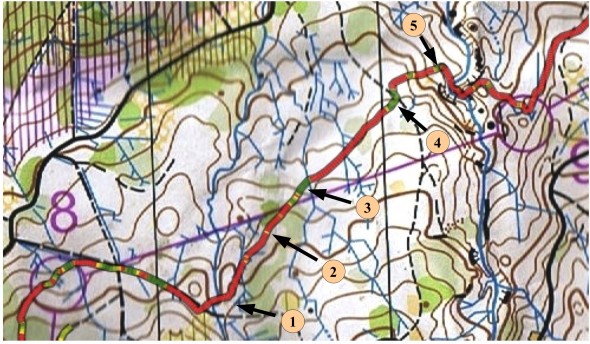
How often do you read the map – and how does it influence on your orienteering speed and the amount of mistakes you do? With an accelerometer attached to the map or to your hand – and combining this with GPS data – it is possible to display on a map at which locations and for how long a runner reads the map. This gives very interesting possibilities regarding analysis of what happens before a runner does a mistake – and also to see if the map reading frequency and length is optimal (see illustration above taken from AMRD webpage, © map: OLG Bern).
Swiss orienteer Michael Eglin has been working on a technique he denotes “Automated map reading detection (AMRD)” in which he uses an accelerometer (a device which can record its orientation relative to the ground) in order to record in which parts of the course a runner looks at the map. By combining this information with a GPS track of the route, the way the athlete reads the map can be analyzed.
Why is this interesting for you as an orienteer?
There are at least two very interesting applications for automated map reading detection:
- Analysis of map reading technique compared to other athletes in order to determine if the map reading technique is optimal. For example to see if the map reading frequency is too high/low, if the map reading time is too long/short (can be coupled to other technical training), how map reading influences on running speed, stop-time at controls / out of controls / into controls for map reading, etc. Having a good map reading technique is vital for a top orienteer – see some discussion about map reading frequency in the o-training.net wiki. At a training camp with the Norwegian team before the 1999 WOC, they did a simple study of the number of times each runner looked at a map on a leg. The best men in the world that year — Petter Thoresen and Bjørnar Valstad — read the map more than 20 times on a 400 meter leg. Hanne Staff, who has been the best woman the last few years, read the map 15 times, while the worst of the women in the test read the map just 5 times.See here for an interesting comparison of map reading technique between two different runners – provided at the blog of Martin Lerjen (German text).
- Analysis of map reading coupled to time losses for a specific race, for example to investigate the map reading ahead of mistakes to see if you can find a relation between too seldom/short map reading and a mistake and how much time you have used for route choices, etc. Martin Lerjen has done such a race specific analysis on his blog (and a second example) (German text) – finding several interesting results regarding the time losses and his map reading technique.
Examples from analysis
Martin Lerjen has done several interesting analysis using automated map reading detection – I have been allowed to provide some examples from Martin’s testing of the method here.
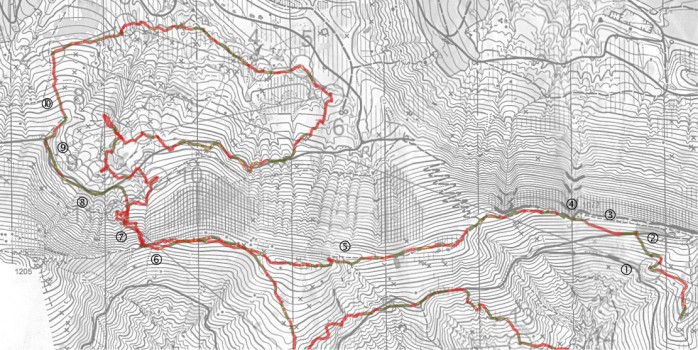
The first illustration is from a national race in Switzerland in October 2010 (Höhrohnen)- run by Martin Lerjen (see full analysis in German here). In the below illustration green color means mapreading – red means no mapreading (interchanging the colors might have been more intuitive?). From the map it is easy to see in which areas the runner reads the map, and in which areas there is no map reading. For this particular terrain there is quite a lot of red – i.e. running without reading the map.
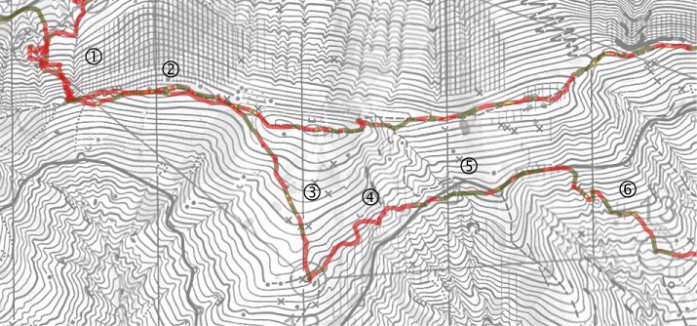
Zooming in on a particular location, you can see more details regarding the map reading technique.
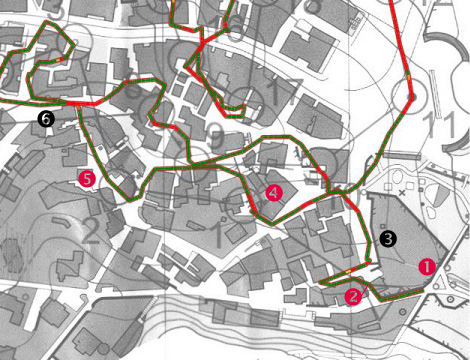
A second example provided is an example from a national sprint race in Einsiedeln, Switzerland (see the complete map in Routegadget here - complete analysis in German see). As you can see, there is a lot of mapreading involved in such a technical city sprint – most of the track being green.
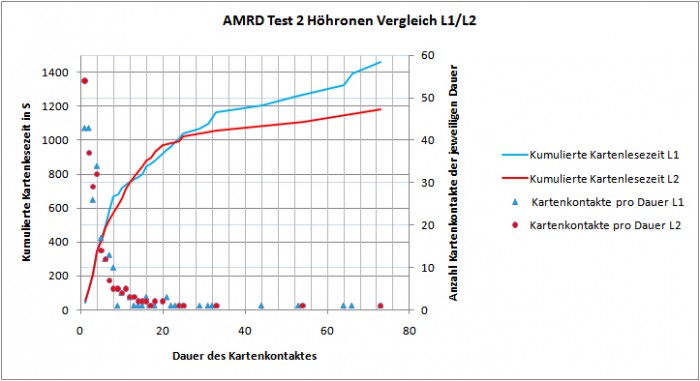
Finally, an example of comparing the map reading technique of two runners – this time again for the Höhrohnen case. The blue and red lines illustrate the accumulated map reading time of the two runners during the race – and the red/blue dots a histogram of length of map reading contacts (complete analysis in German here).
How does it work?
During map reading the hand of the athlete is in a typical position which is significantly different to the position during regular running. While reading the map, the athlete keeps the map close to horizontal – while the map is in a more vertical position while running. Thus, one can easily detect map reading by just recording the position of the hand. To do this, an accelerometer may be fixed to the map reading hand. The sensor moves and tilts with the hand, and from the recorded motion map reading events can be recognized.
See a full description of the method in the AMRD-webpage.
Equipment
Two electronic devices are needed – an accelerometer and a GPS logger. Eglin has been using a HOBO Pendant G Data Logger (Typ UA-004-64) from Onset as accelerometer which is available online for around 150 Euros. Any GPS logger with reasonable spatial resolution can be used (e.g. GARMIN GPS Watches) to track the runners position.
Mobile application
I started work on implementing this kind of accelerometer logging for logging of map reading time in a mobile application last year (as both Android phones and the iPhone/iPod touch have a built-in accelerometer which should have sufficient accuracy and frequency), but have not had time to finalize this work yet. It is, however, not a difficult task – and it should therefore be quite feasible to do this kind of analysis with holding your mobile phone or iPod touch under the map instead of buying a dedicated logger device. Some work is started for both an iPhone and Android application – I’ll try to get the work done during the winter months. If somebody else has worked on this already – please let me know in the comments. In a mobile phone, you can either use the built-in GPS or use an external GPS like a GPS watch (using an external GPS watch will give you better accuracy).