Jukola and Venla 2011 decisions: Meter by meter
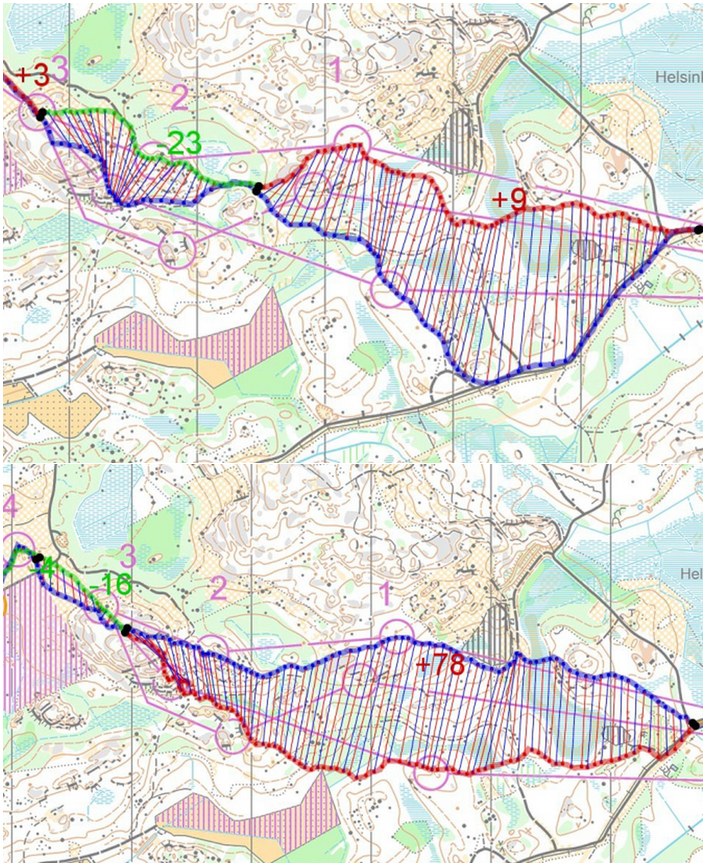
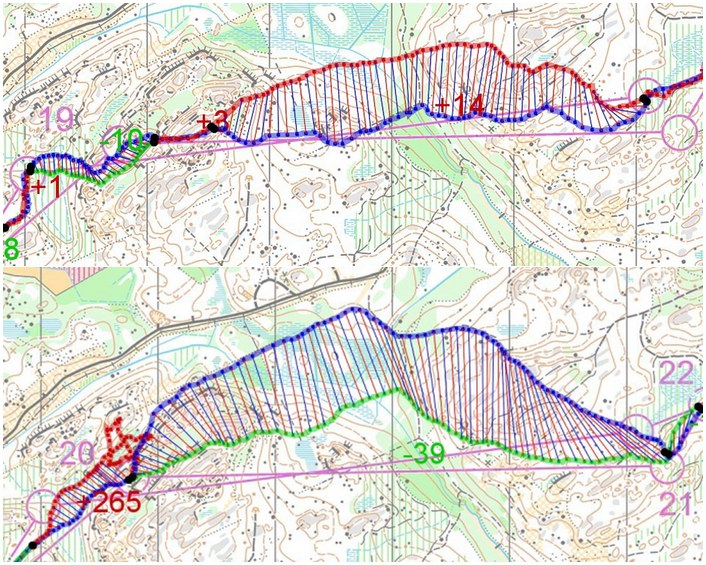
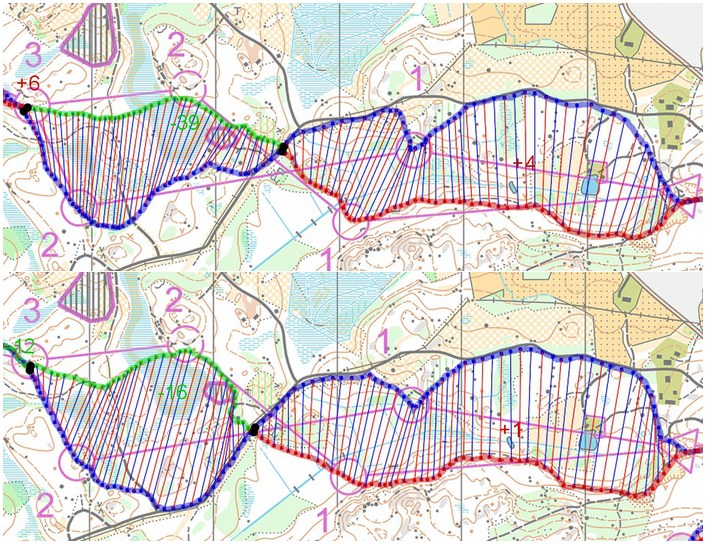
Comparison of the two top teams in the Jukola and Venla relays – meter by meter. Study how the runners on the winning team performed and how the forkings worked using very illustrating autOanalysis figures. This autOanalysis functionality is planned to be included in 3DRerun eventually, to make it possible for YOU to make similar illustrations for your own competitions and trainings.
I won’t include a full analysis of the Jukola and Venla relays here, but just point at some interesting information you can find from these kind of illustrations. Similar illustrations from all legs in both Jukola and Venla are included below for you to enjoy.
- Example 1: Comparison of first leg and second leg for Halden and Kalevan Rasti. The upper part of the illustration is the first leg with Kalevan Rasti in red/green and Halden in blue. The second one is the second leg with opposite coloring. As you can see, Halden looses significantly more time than KR for this forking (mostly due to mistake at the second control).

- Example 2: Again 1st versus 2nd leg for Halden and KR – same coloring. This time the second long forking. This time KR looses a lot more time due to big mistake at 20th control.

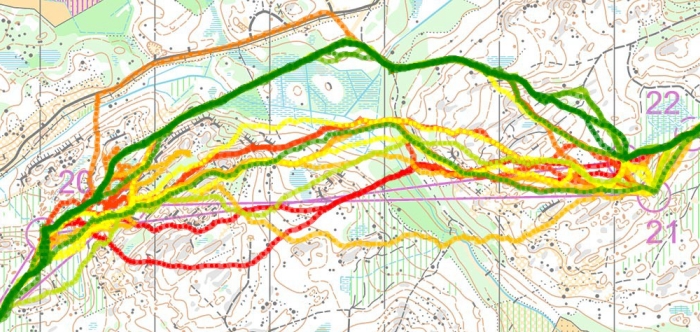
- 2nd leg only. See how all the fast times of the GPS-tracked legs run along Halden’s route.

- The biggest time losses of Olav Lundanes (Halden) on the last leg compared to Fabian Hertner (Kalevan Rasti). Overall Lundanes did not loose time to Hertner on many sections – mostly a maximum of a few seconds. There is however one significant time loss by Lundanes to the 11th control (62 seconds) compared to Hertner – if Hertner would have had a little bit better day, this could have been enough to catch Lundanes.

- First two Venla legs compared for top teams Domnarvets GoIF and Tampereen Pyrintö. The upper one is leg 1 with Domnarvet blue and TP red/green. The lower one is leg 2 with opposite coloring. The same pattern for both cases – but TP looses less time overall on this forking for both legs compared. The significant time loss for Domnarvet is just ahead and after the the second control.

Note! This stuff should have been published Tuesday morning, but a certain forking mistake made it necessary to push it a few days. Hope you still enjoy it…Jukola 2011
- Jukola leg 1: Halden vs Kalevan Rasti – All routes as colorplot
- Jukola leg 2: Halden vs Kalevan Rasti – All routes as colorplot
- Jukola leg 3: Halden vs Kalevan Rasti – All routes as colorplot
- Jukola leg 4: Halden vs Kalevan Rasti – All routes as colorplot
- Jukola leg 5: Halden vs Kalevan Rasti – All routes as colorplot
- Jukola leg 6: Halden vs Kalevan Rasti – All routes as colorplot
- Jukola leg 7: Halden vs Kalevan Rasti – All routes as colorplot
Venla 2011
- Venla leg 1: Domnarvet vs Tampereen Pyrintö – All routes as colorplot
- Venla leg 2: Domnarvet vs Tampereen Pyrintö – All routes as colorplot
- Venla leg 3: Domnarvet vs Tampereen Pyrintö – All routes as colorplot
- Venla leg 4: Domnarvet vs Tampereen Pyrintö – All routes as colorplot