GPS Analysis HowTo Presentation (Norwegian text)

Posted by Jan Kocbach, 27 Jun 2011@22:00

gpsanalyse

This Norwegian text HowTo-presentation about GPS-analysis might be interesting for some of the readers of o-training.net. The presentation was held June 12th at a Training seminar in Løten, Norway with 80-100 attendees.

In addition there was also a very interesting presentation by Kenneth Buch about “the athlete conversation” – how he speaks to and guides his athletes.

For both cases the slides only tell part of the story, but it might still be instructive to take a look at them.

Jukola and Venla 2011 decisions: Meter by meter

Posted by Jan Kocbach, 23 Jun 2011@5:00

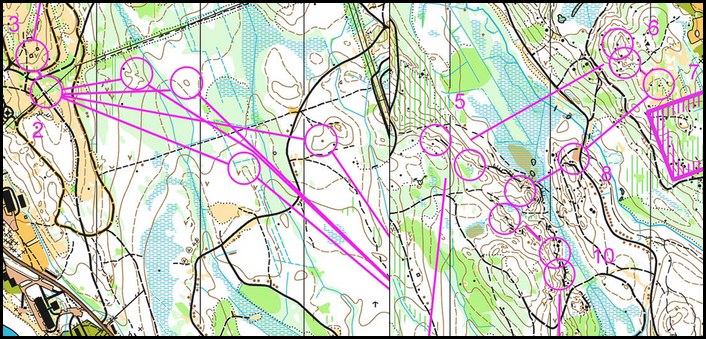
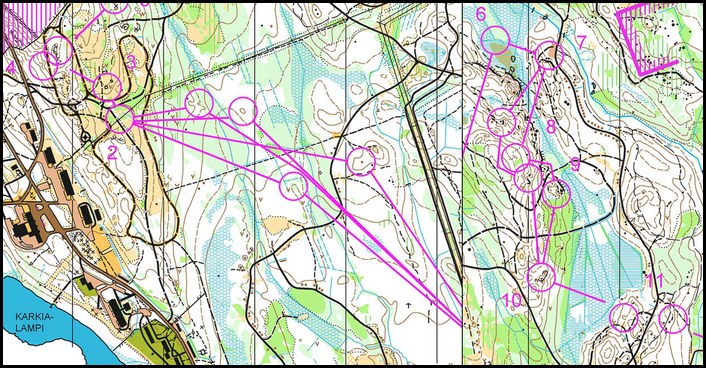
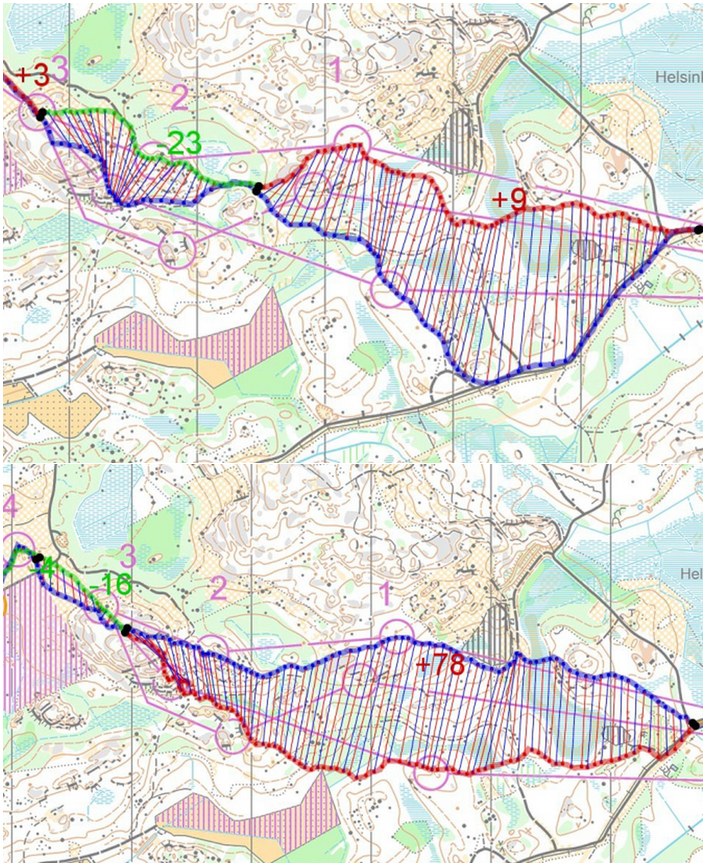
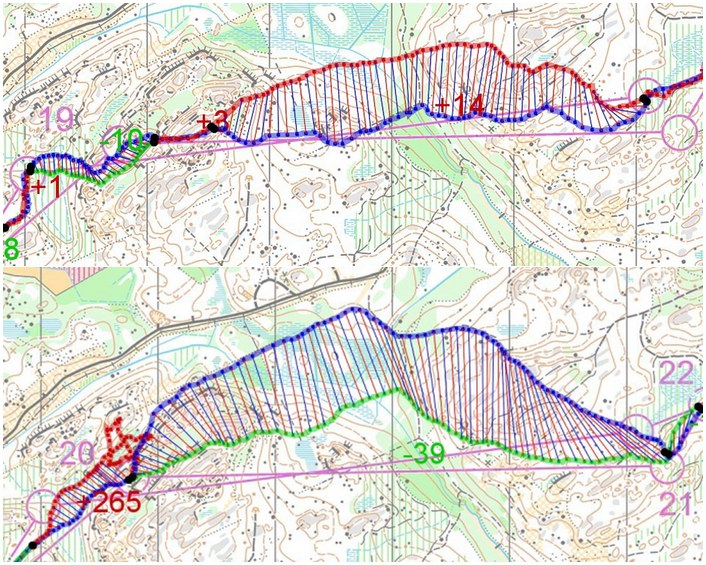
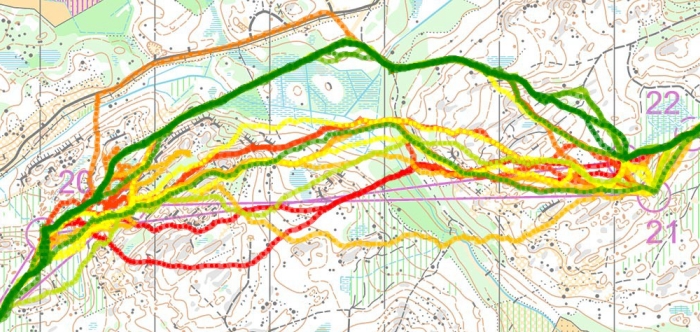
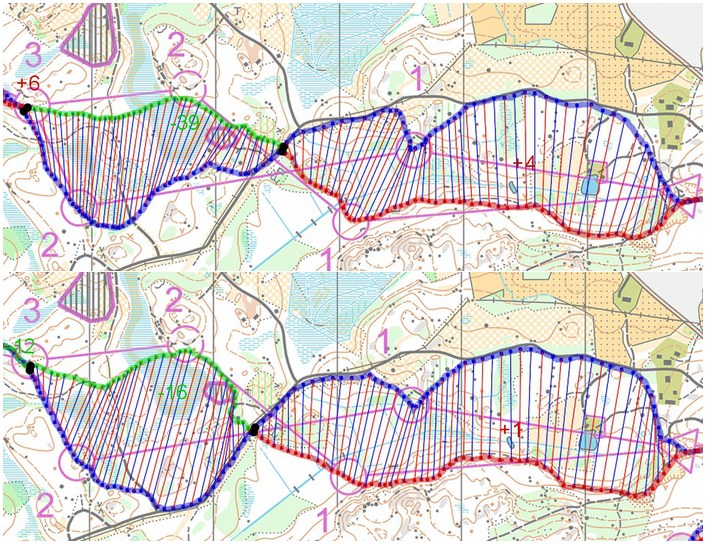
Comparison of the two top teams in the Jukola and Venla relays – meter by meter. Study how the runners on the winning team performed and how the forkings worked using very illustrating autOanalysis figures. This autOanalysis functionality is planned to be included in 3DRerun eventually, to make it possible for YOU to make similar illustrations for your own competitions and trainings.

I won’t include a full analysis of the Jukola and Venla relays here, but just point at some interesting information you can find from these kind of illustrations. Similar illustrations from all legs in both Jukola and Venla are included below for you to enjoy.

Jukola countdown -2 days: Learn about Jukola forking

Posted by Jan Kocbach, 16 Jun 2011@5:00

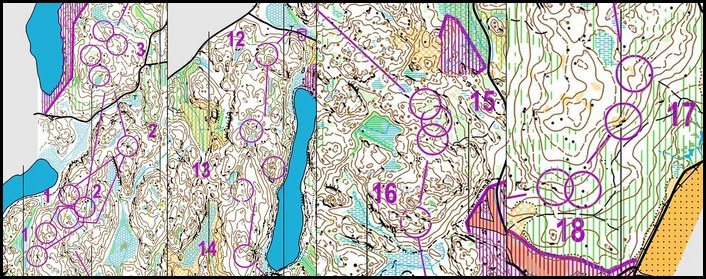
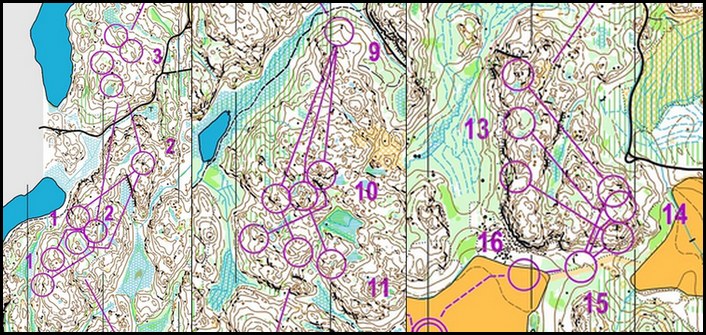
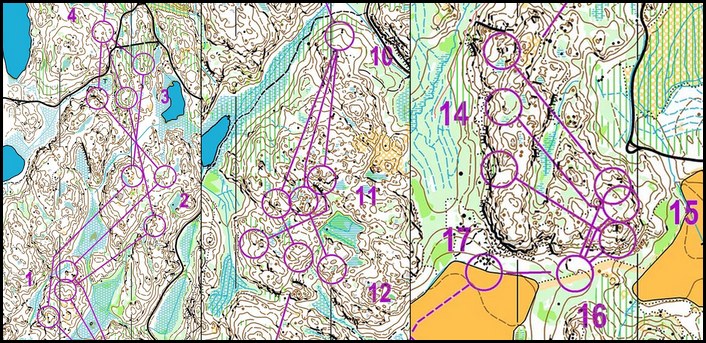
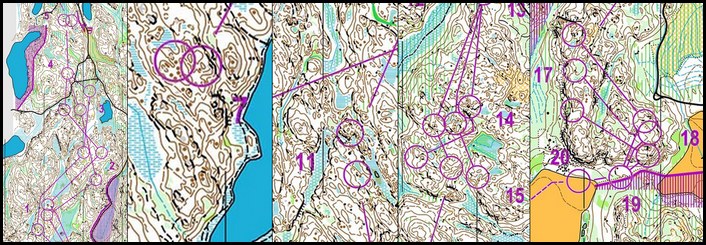
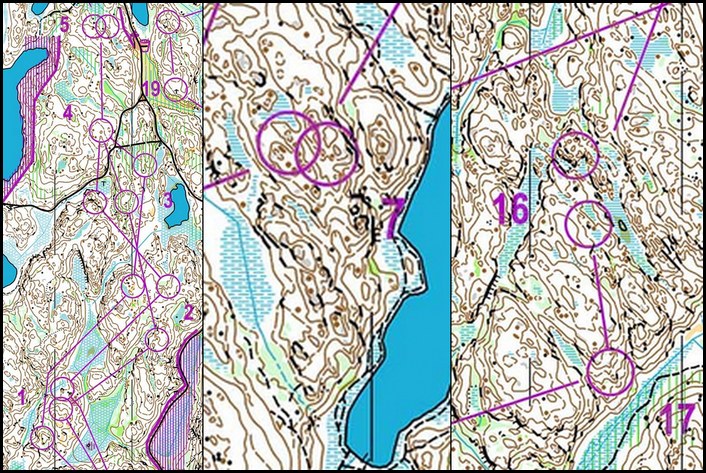
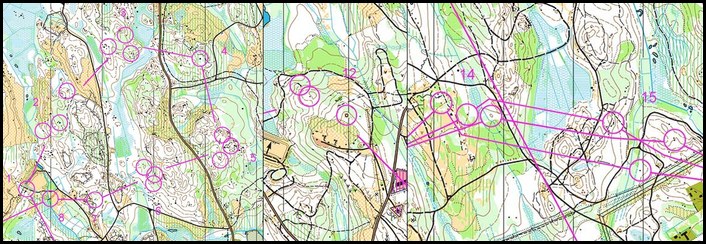
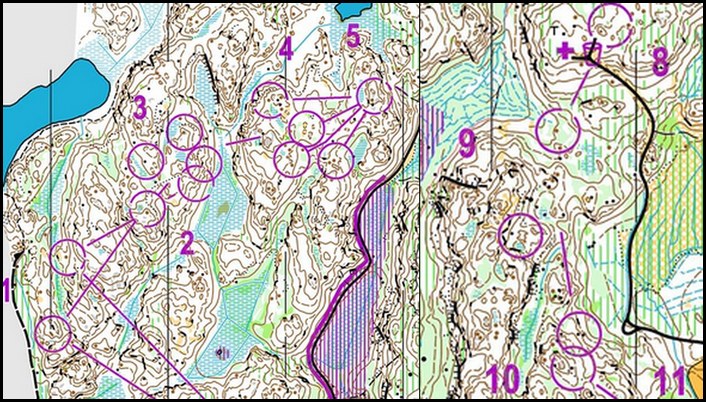
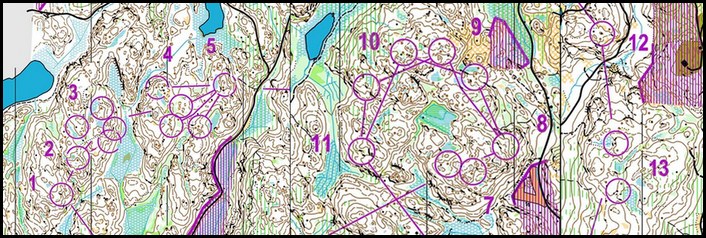
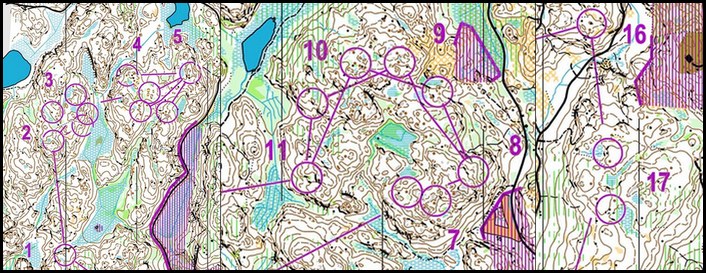
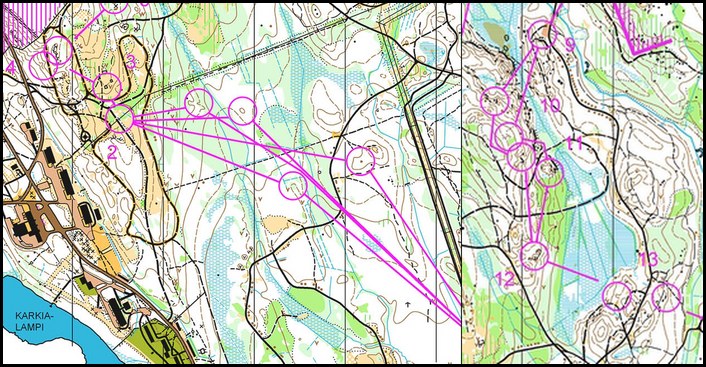
See all forked controls for Jukola 2010, 2009, 2008, 2007 and 2006 – and Venla 2010 and 2009 – in one page – and try to understand what will meet you on the Jukola relay on Saturday. If you were searching for an easy answer, I got to disappoint you.

It is good preparation for Jukola to take a look at the forking schemes for the last editions of the relay

The answer on the above question: It is totally unpredictable. Forking varies a lot from year to year in the Jukola relay. The year of 2008 was a year with a lot of forking – most controls on the first leg where forked in 2008. In 2009 there was a lot less forking – and 2010 was also far from the standard set in 2008. It may seem like the amount of forking in Jukola has been going down the last year. However, as stated above it is totally unpredictable, so you won’t know until you have the map in your hand on Saturday or early Sunday morning.

Good preparation for Jukola

On the other hand, it is good preparation for Jukola to take a look at the forking schemes for the last editions of the relay. As you can see, there are a lot of different types of forkings used. The main types of forkings can be categorized into three types:

  • Type 1: One single forked control, for example
    • Start – 1 – A – 3 versus
    • Start – 1- B – 3
    • … and up to four variants
  • Type 2: A forked leg, for example
    • Start – 1 – A1 – A2 – 4 versus
    • Start – 1 – B1 – B2 – 4
    • … and up to four variants
  • Type 3: A group of two forked legs, for example
    • Start – 1 – A1 – A2 – A3 – 4 versus
    • Start – 1 – B1 – B2 – B3 – 4
    • … and up to four variants

The ones defined as type 3 are the most complex ones, and especially if the legs are long and the variants are crossing each other these may lead to significant mistakes and confusion for the runners. The ones defined as type 1 are the ones giving the least spreading, but they may still be tricky. It looks like we have been getting more of type 1 and type 2 forkings and less of type 3 forkings the last years.

Enjoy the forkings of the last editions of Jukola below!

Jukola 2010 – Leg 1 & 2

2011_01

Jukola 2010 – Leg 3

2011_03

Jukola 2010 – Leg 4

2011_04

Jukola 2010 – Leg 5

2011_05

Jukola 2010 – Leg 6

2011_06

Jukola 2010 – Leg 7

2011_07

Jukola 2009 – Leg 1

2009_01

Jukola 2009 – Leg 2

2009_02

Jukola 2009 – Leg 3

2009_03

Jukola 2009 – Leg 4 & 5

2009_04_05

Jukola 2009 – Leg 6

2009_06

Jukola 2009 – Leg 7

2009_07

Jukola 2008 – Leg 1

2008_01

Jukola 2008 – Leg 2

2008_02

Jukola 2008 – Leg 3

2008_03

Jukola 2008 – Leg 4 & 5

2008_04_05

Jukola 2008 – Leg 6

2008_06

Jukola 2008 – Leg 7

2008_07

Jukola 2007 – Leg 1 & 2

2007_01_02

Jukola 2007 – Leg 3

2007_03

Jukola 2007 – Leg 4 & 5

2007_04_05

Jukola 2007 – Leg 6

2007_06

Jukola 2007 – Leg 7

2007_07

Jukola 2006 – Leg 1, 2 & 3

Note! Some forking controls missing here for the 2006 case.
2006_01_02_03

Jukola 2006 – Leg 4 & 5

Note! Some forking controls missing here for the 2006 case.
2006_04_05

Jukola 2006 – Leg 6 & 7

Note! Some forking controls missing here for the 2006 case.
2006_06_07

Venla 2010 – Leg 1 & 2

v2011_01

Venla 2010 – Leg 3

v2011_03

Venla 2010 – Leg 4

v2011_04

Venla 2009 – Leg 1 & 2

v2009_01

Venla 2009 – Leg 3

v2009_03

Venla 2009 – Leg 4

v2009_04
Jukola countdown -9 days: 3DRerun for pre-race analysis

Posted by Jan Kocbach, 09 Jun 2011@8:00

juk2011
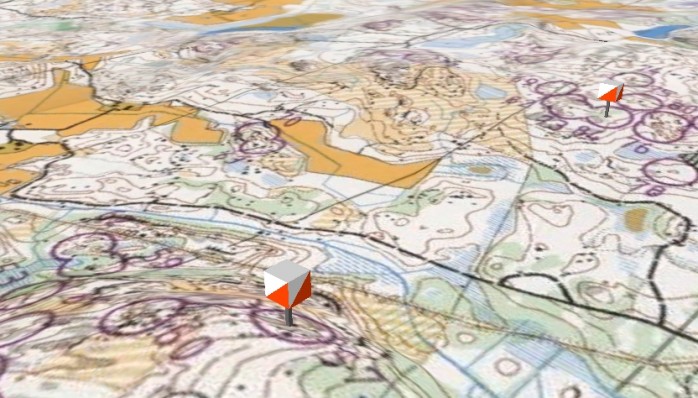
3DRerun is mostly a tool for analysis after races, but it does also have some interesting functionality which can be useful for pre-race preparation. One of these functions is “Measure lines”, where you can draw imaginary routes on an old map of the competition area, and compare route lengths and running times for the routes. The other is to replay competitions and trainings of competitions close to the race area.

The screencast below shows you how to do pre-race preparation in 3DRerun – it does not give you the actual preparation though. If you’ll rather help yourself, you can go directly to 3DRerun for the maps which are discussed in the screencast:

To get full insight into how to use 3DRerun for pre-race analysis, my tips is to take a look at the 10 minute screencast below though. It won’t give you any specific info for Jukola 2011, but it will help you to use 3DRerun more effectively.

Jukola countdown -12 days: HeadCam video with map

Posted by Jan Kocbach, 06 Jun 2011@8:00

This HeadCam video with accompanying map from the neighbor terrain of Jukola 2011 is a nice way to prepare for Jukola 2011. The Häppilä map featured in this video is one of the Jukola 2011 training maps. The video is from a national race in this terrain in early May this year.

Sit back and enjoy – the video is 37 minutes long… By comparing map and video you can understand how the map and the terrain compares – and get prepared for the challenges you will meet at Jukola 2011.

The video is made by Jarkko “Mr. Routegadget” Ryyppö. This is probably one of the most advanced HeadCam videos from orienteering events made yet. Follow the Routegadget page on Facebook to get updates from Jarkko.

Here is another HeadCam video from the same terrain – but without map. This is from May 29th – so the vegetation is closer to what you can expect at Jukola 2011:

Häppilä, training 29.5.2011 from Jarkko Ryyppö on Vimeo.

Jukola 2011 webpage

Using Performance Index for race analysis (screencast)

Posted by Jan Kocbach, 01 Jun 2011@8:00

perfindex
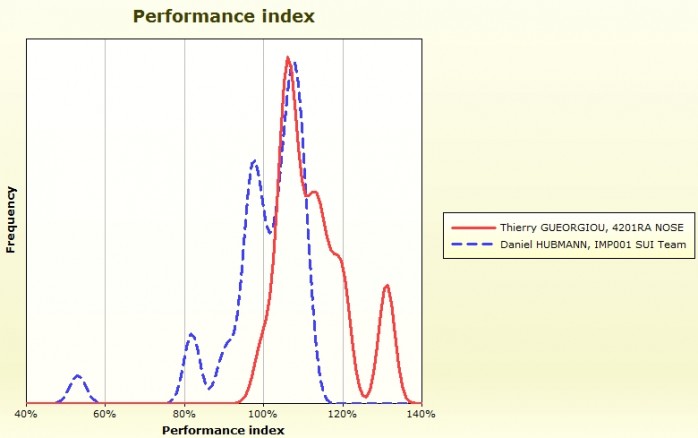
This video compares the performance of Hubmann, Gueorgiou, Rollier and the other top runners in Sunday’s event on Le Revard by analyzing the Performance Index in WinSplits Pro. In this era of GPS analysis, many forget the value of analyzing the split times. There is however a lot of useful information hidden in the splits.

The motivation behind this screencast is to show how the Performance Index can give you insight into the potential of different runners based on their current abilities – both running speed and o-technical abilities. This can be useful to assess the potential of yourself or somebody you coach if you are a trainer. The analysis is done in the program Winsplits Pro (which comes at a price of around 60 Euro) – a very useful tool by Mats Troeng – the man behind QuickRoute. I am no expert on either WinSplits Pro or the Performance index – if I missed something important, please add a comment below to let me know.

PS! Screencasts is new to me – and I consider this as a test. Is this something which I should continue making at o-training.net for other topics as well? Does the format work? Too slow and boring? Warning: If you are not above average interested in orienteering analysis, this is probably nothing for you! No fancy moving stuff to keep your attention.