GPS Analysis for Orienteering: All the Basics!
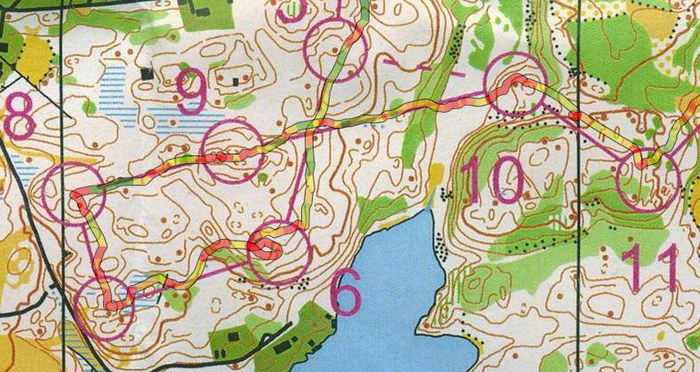
Step-by-step instructions for effective use of QuickRoute for analysis of trainings and competitions: GPS analysis has been a revolution for analysis of technique in orienteering. This article considers the basics for analysis of orienteering races or trainings: Software, Equipment, Step-by-step instructions for getting your route on the map, and tips regarding o-technical analysis. This article considers a single GPS track from a single runner – a later article will consider analysis of more than one GPS track/runner (which gives you a lot more input).
With the tools and equipment available today, GPS analysis of orienteering activities is quite simple – and a lot of orienteers do GPS analysis of their races and competitions. Still, based on all the requests I get about the topic, it looks like a simple set of step-by-step instructions along with equipment tips would be welcomed. This article takes you through the basics – it will be updated based on comments and questions.
Note! This article starts on a very basic level, to appeal to orienteers who have never tried GPS analysis yet. If you are already familiar with getting your route into QuickRoute, you may jump directly to the analysis section. You should nevertheless take a look at what is written about route adjustment, as that is an area where many don’t pay enough attention.
Equipment and software
- The best option for analysis of a single GPS track is definitely QuickRoute
For equipment there are a lot of options which all will give you excellent data for analysis. I have listed many options in the “Equipment” section below – my personal preference is one of the Garmin GPS watches (with pulse if possible, as this adds further to the analysis – the best option has a possibility to record every second). In the step-by-step instructions I will assume that you either have a Garmin GPS watch or that your GPS comes with software which allows you to export a GPX-file (GPX is a standard file format for GPS data).
For software, the best option for analysis of a single GPS track is definitely QuickRoute, in my opinion (you may also combine it with 3DRerun – see more info in the software overview below). Thus the step-by-step instructions below are based on using QuickRoute for the analysis. Note that you need a Windows PC to use Quickroute. Several other software options are listed in the software section at the bottom of this article.
Step-by-step instructions: Getting your Route on the Map
These step-by-step instructions take you through all you need to get started with GPS analysis of an orienteering activity.
- Step 1: Record your GPS track on the orienteering course. For a Forerunner GPS watch, all you need is to start the stopwatch in order to start the GPS track – and stop the stopwatch in order to finish it. The GPS track will then be stored in the watch, ready to transfer to the computer when you get back home. Tip: The GPS watch should lie on the ground – turned on in GPS mode – for at least 5 minutes ahead of your activity in order to get a good GPS fix. This will increase accuracy significantly. For the Forerunner 405/310XT it is best to start the stopwatch before you lie the watch on the ground to make sure you get a good GPS fix. If you use another GPS unit than a Forerunner watch, refer to the instruction manual regarding how to record a GPS track (you should still put it on the ground for 5 minutes, though).
- Step 2: Download QuickRoute from here, and install the software (requires Windows). Tip: The development version has some new features, and might run more stable on some computers.
- Step 3: Scan your orienteering map from the competition, or even better get a jpg/gif export from OCAD of the course for maximum accuracy. You may also take a photo of the map, but this gives poorer accuracy. Tip: (1) Always scan the map with North up – or at least rotate before you load it in QuickRoute – a rotated map may in many cases make adjustment of route more difficult. (2) It is often advantageous to reduce the size of the map file to around 1-1.5 Mb for QuickRoute to work faster – you usually don’t need more than around 200 dpi for your analysis.
- Step 4: Connect the GPS unit to the computer after installing the required drivers. If you have a Forerunner 405/410/310 XT/610/910XT, you don’t even need to connect the GPS to the computer – all you have to do is to insert the ANT USB key, and the GPS data is transferred automatically. It you have a Forerunner 305/205, you must connect your GPS to the computer, but you don’t need to transfer anything (that is done in QuickRoute). For other GPS units, you need to transfer the GPS route to the computer according to the manual for the GPS unit, and then export to a GPX-file or other compatible QuickRoute format.
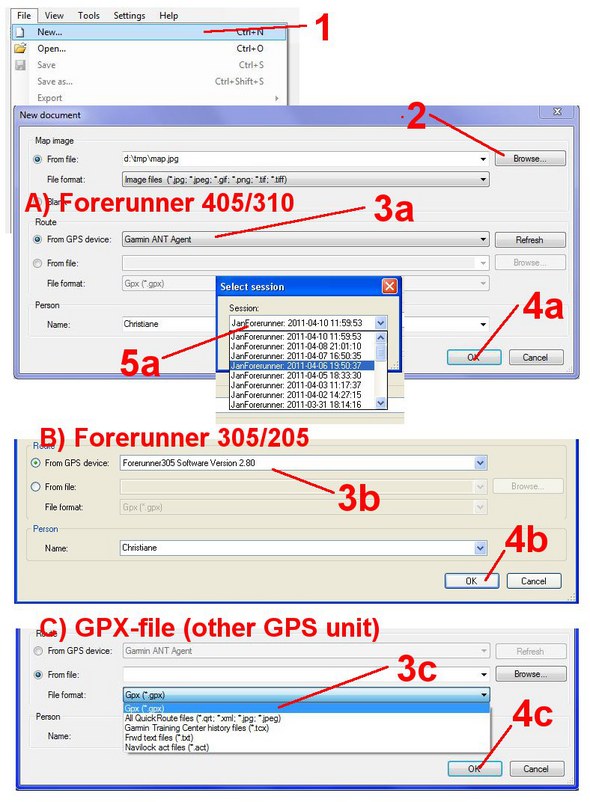
- Step 5: Start QuickRoute, and open the menu entry “File -> New” in order to start a new activity (see 1 in illustration below). Then locate your scanned map file on the disk (2 in the illustration). Depending on which GPS unit / watch you have used, there are now three different options (but all are easy). For a Garmin Forerunner 405/410/310 XT/610/910XT or other unit which uses the Garmin ANT agent, choose “Garmin ANT Agent” under “From GPS device” (3A in illustration), click OK (4A) and find the activity on the watch (5A). For a Garmin Forerunner 205/305, choose “Forerunner 305″ in From GPS device” (3B in illustration), and click OK (4B), and then find the activity you want to analyze. For other GPS units, choose “From file:” and under “File Format” choose “GPX-file” (3C) – and locate the GPX-file on disk using the “Browse” button, and then click OK (4C).
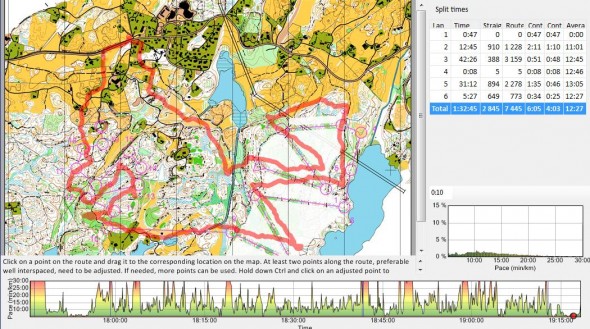
- Step 5: Opening the map with route. Now you should get up the map and the route – but the two don’t fit very well. Below is an example of what you could see after opening map and route. We will now adjust the route to the map.
- Step 6: Adjusting the route to the map. This is the crucial step – in which many don’t pay enough attention. Remember that if your GPS track has good quality, and the map is fairly good, you should be able to get a quite good fix by adjusting only two(!) points. Thus try to get optimal results with adjustment of only two points before proceeding to analyse with more points. Point adjustment is done by clicking the mouse on a point on the route, and dragging this point to the correct point on the map (you will note that all of the route moves when you do this for the first point.(1) Find one point at the route where you are 100% sure that you were, for example a bend on a road/track or similar. In the example below the bend of a path is chosen (blue point). Tip: Use the “+” and “-” symbols on the toolbar to zoom in and out on the map to make adjustment easier. Note that when you use the “+” and “-” symbols, QuickRoute thinks that you have finished adjusting your map, and you have to go back in adjustment modus (click the adjustment mode symbol on the toolbar
 )
)
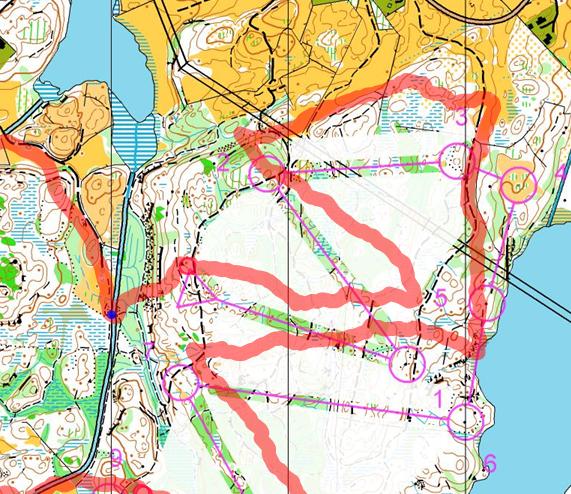 (2) Take a second point – preferable as far away from the first point as possible, and move this point until all of the route fits as well as possible (thus, don’t pay attention to point 2 only, but all of the route). Now you usually should get a quite good fit. See the current example below – adjusted with two points. Tips: (1) If it didn’t work well the first time, you can move the first point and try again (maybe you didn’t hit well with the first point – this was the case for my current example). (2) This may give non-optimal results if one of the points is at the start of your track, and you had a bad GPS fix at the start of your exercise. Try again with points later in the exercise in this case. (3) You can unselect one of your chosen points by clicking “shift” + the left mouse button – and choose two other points instead to see if this gives better results. (4) If you use split times on a Forerunner watch at the control points, these will show up in QuickRoute as red circles. These may make adjustment easier – but remember to still start with only two points to get optimal adjustment also between the control points due to algorithms used.
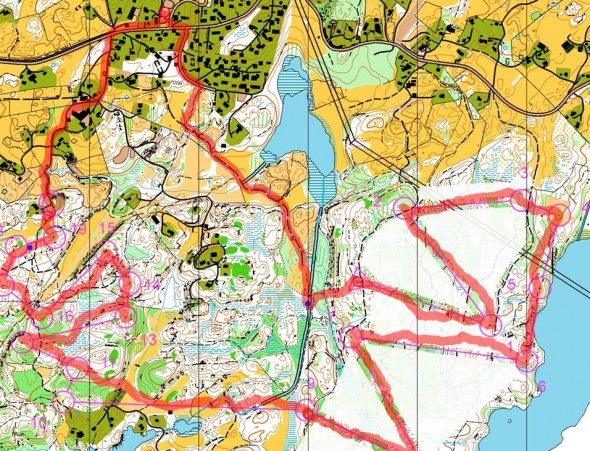
(3) If necessary, you may adjust more points to get good adjustment in certain parts of the course where you have problems, but be patient and try to get a good adjustment with only two points. This gives you better overall correspondence between map and GPS data. Furthermore, if you want to use 3DRerun for analysis (see further down for more info on this), you will consistently get bad results in 3DRerun if you use more than 2 calibration points in QuickRoute.
- Step 7: Now your route and map is calibrated, and you are ready for analysis. Click the analysis mode symbol on the toolbar in order to go into analysis mode
 . You will now see your course with the track overlaid in different colors (see example below for part of the current course).
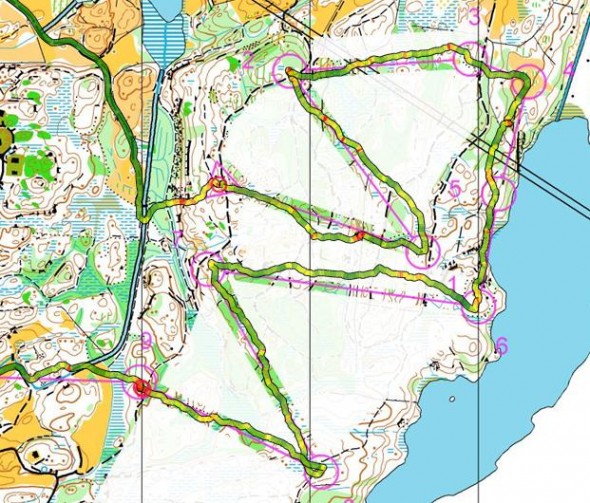
The standard analysis mode when QuickRoute starts is to show a color along your route according to your pace (in min/km) – where green is fast and red is slow. Before you proceed with further analysis, you should adjust the pace settings in order to get colors on the track which give you the information you need (having a totally green track doesn’t tell you much, the same with total red – you should be able to identify the spots where you slow down / loose time and speed up), and also adjust track width, transparency and so on. Pace is adjusted by changing the numbers marked with (2) and (4) in the illustration below (given as 5:08 and 14:07 in the example). Transparency is adjusted using (7), and line width and border thickness with (8) and (9), respectively. Optimal values depend on the map resolution and what kind of analysis you are performing. Note also that you can change from Pace analysis to Hear rate analysis or Direction deviation analysis using the menu marked with (1) in the illustration below (will be needed later on in the analysis).
- Always scan the map with North up – or at least rotate before you load it in QuickRoute
Now everything is ready for analysis. Analysis of orienteering activities in QuickRoute is covered below.
Typical orienteering analysis session
Before going into the analysis techniques in QuickRoute in detail, I will just repeat a typical analysis session as described in the article about analysis of HeadCam videos – as a systematical approach is very important in order to really improve. Also, it is important to note that what you should optimize is YOUR optimal orienteering technique – which is a balance between your current orienteering technique and running speed. How fast can you run while still orienteering well enough to not make mistakes?
- Identify how to act in the future to avoid this type of time loss
A typical analysis session goes as follows
- Identify mistakes/time-losses by split times and/or GPS data.
- Identify the reasons for the time loss using a combination of GPS track, split times and other information available about the situation.
- After finding the reason for the time losses, identify how to act in the future to avoid this type of time loss. This should be defined in form of one or more tasks which can be trained on in a targeted way in future trainings/competitions – and then evaluated using a similar analysis in the future. This last step is actually the most important step in the analysis – don’t stop at step 2!!
In addition to finding time losses, you should also focus in similar manner on the parts of the route where you performed well. What was the reason for performing well – what should you do to repeat your good performance in the future.
Analysis of orienteering activities using QuickRoute
- Remember to write down your analysis to make sure you can learn from it
There are a lot of possibilities for analysis in QuickRoute. Not all of them will be covered in full detail in this article, but pointers will be given towards many of the options you have. Note that a basic split time analysis is very useful along with the GPS analysis – it is even better to be able to compare your GPS track with other GPS tracks (which is possible in e.g. 3DRerun, RunoWay, GPSseuranta, MapandCoach or Routegadget) which will be covered in a later article.
The reason for doing the analysis below is to be able to understand and identify the reason for all time losses. When you have understood the reason for the time losses, you can work on improving your orienteering technique to avoid these time losses in the future. Remember to write down your analysis to make sure you can learn from it!
A typical problem with orienteering analysis is that it is not easily measurable. For a track and field 800 meter runners it is easy to see when the training works (the time on the 800 meter goes down) – for an orienteer it is not that easy to see when o-technical training works. By doing proper GPS analysis of trainings and competitions – analyzing how the size and distribution of mistake varies with time, and also using the suggested measurables given below e.g. for time in/out of the control for control taking training and direction deviation for compass training, you can much better evaluate your training.
Use “split times” along with the “split times table” in the right pane of QuickRoute in order to get more out of your analysis (see illustration below). You can either use your original split times from a Garmin watch, or make your own split times at arbitrary places along the course – wherever you need them for your analysis. Instructions:
- Click the add split time symbol in the toolbar (
 ), and then click anywhere on your route to add a split (red circle) at this positions (use the shift key and the mouse button to remove a split point). You typically insert splits at control point locations, but based on which analysis you want to do (as discussed below), it may also be at other spots. If you have takes split times on your Garmin watch, they will automatically be set in QuickRoute.
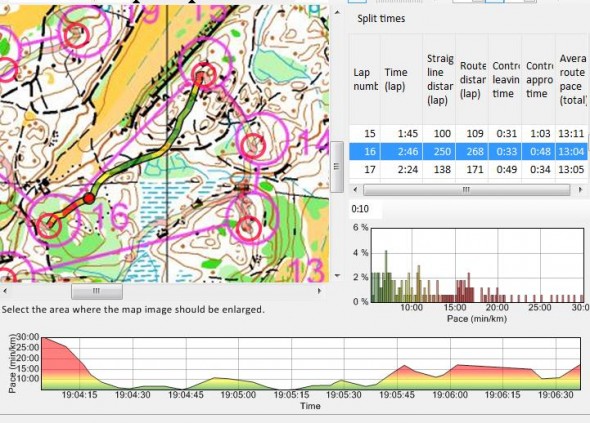
 - You now get a table in the right pane of QuickRoute with information about each leg. You can choose which custom columns to show in the table by right clicking the table and choosing “select columns”. Lap time, average pace, time in/out of control circle, average heart rate and direction deviation are some examples of fields you can get in the split times table.
- You can now click each leg in the table in order to highlight the leg in question, as seen in the example below for leg number 16. In the table you then get key parameters about your performance. This may be very helpful in your analysis.
Now over to how to perform the analysis:
- Analysis of time loss for direct control mistakes. Identify a mistake on the course either by looking at the GPS track or by comparing split times from the event with others. Below one (small) mistake from the example at the 13th control has been identified. To find out how much time you lost for your specific mistake/time loss, you can move the mouse pointer along the route – you should now see a red circle moving along with the mouse pointer. If you look at the bottom of the screen, you see an equal red ball dancing along a curve showing your pace as a function of time along the course. Below this curve, you see “Time (lap):” and your lap time. By moving the mouse pointer along your GPS track and noting the time at different points along the track, you can thus easily identify how much time you use (and loose) on a specific part of the track. (alternatively you can add split times at the start/end of the mistake using the add split time symbol as described above).
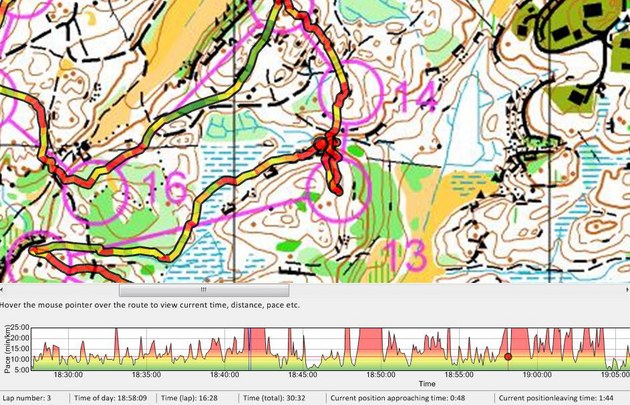
This is a good method to understand exactly how much time you loose on direct mistakes – and a typical first step in an analysis session. After understanding how much time you lost, you need to understand why you did this mistake – and how to avoid this type of mistakes in the future. The GPS track along with your memory of the situation can often give you the answers you need (a headcam might give you even more information). Was the mistake based on a direction mistake? Did you run with too high speed / too little control towards the control? Did you forget to make a proper plan on the leg? Did you forget to have a proper secure attackpoint for the control? Did you use the most appropriate details in your orienteering? Did you simplify the leg enough? And so on.
- Analysis of pace in different terrain types/characteristics. Using the GPS data, you can understand how your running speed varies in different terrain types / uphill / downhill, and use this to learn what is the best route choice for you. The best way to perform this type of analysis, is to make “split times” for different types of terrain in order to analyze your capabilities, and make a “split time table” showing your pace in min/km for different terrain types. By making a similar table for different runners (you can do this in your club for a specific training), you can also find how your relative pace in different terrain types varies compared to other runners – and find your strengths and weaknesses. Knowing your strengths and weaknesses, you can use this in your strategy – and also use it in order to see where you need to improve.
- Analysis of time loss for bad route choices. This one is a bit more tricky using only a single GPS track, but you should be able to identify some of the time losses by analysing the GPS track with pace data overlayed.
- Identifying smaller time losses using pace curve. The pace curve seen at the bottom of the screen is a very good tool to identify smaller time losses. You should go through regions where the pace is higher (red on the curve), and understand the reason for the pace being higher – especially in areas where you loose time based on your split time analysis. In many cases the pace is high due to uphills, bad runnability etc., but there is often some information to gain from identification of pace variations (there is a lot more to gain when comparing with other GPS tracks on the same course, though). One type of pace increases to look for is stops to read the map. Another type of pace increase is due to running through areas with poorer runnability. See also “identify time lost due to uncertainty” below.
- Identify time lost due to uncertainty. Many time losses can be traced back to uncertainty, i.e. keeping a lower speed due to not having the situation under control, and thus (1) reading the map more often/retrospectively and (2) generally keeping a lower speed. Try to identify these time losses using the GPS data. You can train targeted on avoiding time lost due to uncertainty by reading the map more in advance, simplification, etc.
- Analysis of time in and out of control. GPS analysis is a good tool in order to analyse your control work, i.e. the time you use in and out of the control. In the “split time table” in the right pane you can set up a column to be the time into the control and another column to be the time out of the control (the size of the control circle can be chosen in the settings, default is 45 meters. You now get a number which tells you how good you perform in the control area – a very important area in orienteering. You can now work targeted in competitions/trainings on improving this number (be a bit careful with evaluation though, as the time in/out of control varies with terrain, elevation etc.).
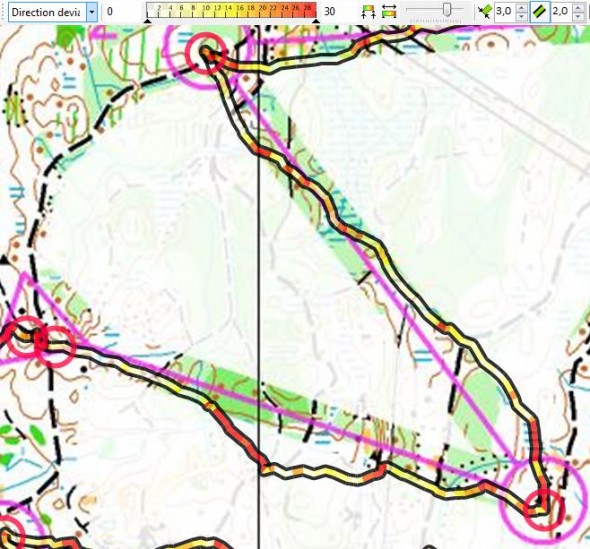
- Identifying time losses based on direction running efficiency. One way to identify smaller time losses is to see if your curve is straight in areas where you should run in a straight line/compass course – i.e. look at your direction deviation. If your route has many small S-curves here, you need to work on your straight running / compass running. You can evaluate direction deviation directly in QuickRoute by adding split times for controls using the add split time symbol in the toolbar, and choosing “Direction deviation” instead of pace to color the GPS track (see sample below). If you set e.g. 30 degrees direction deviation to be colored red as in the illustration below, you can easily identify the spots where your direction running between two controls was not good (see e.g. red areas in the example below on the way to the first control. You can also get the average direction deviation on each leg in the “split time table”. Thus you again get a number which tells you how good you perform in your training/competition, which you can work targeted on improving.
- Heart rate analysis. If you have used a Garmin watch with heart rate information (some other watches also give you heart rate information along with your GPS track), you can analyse how your heart rate varied during the competition/training, and thus how your heart rate influenced on your o-technical performance. You typically start this type of analysis by choosing “Heart rate” instead of pace to color the GPS track (see sample below). Now you can see how your heart rate varies during the race the same way as you did for the pace. Did you push too hard giving you too high heart rate ahead of a mistake? Did you open too hard and therefore not manage to keep up the heart rate during all of the race? Here is an example where the GPS track is colored with heart rate:
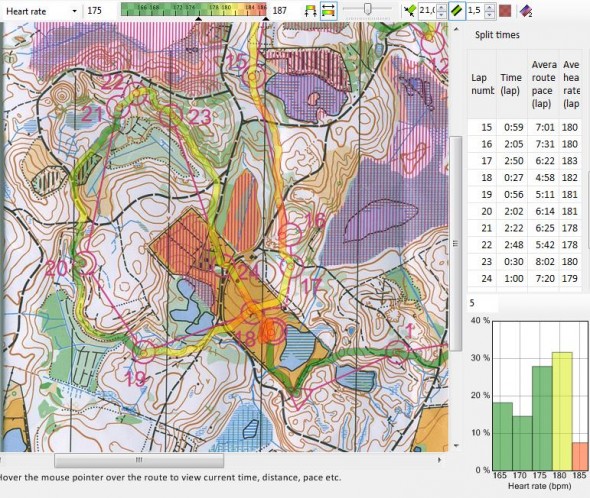
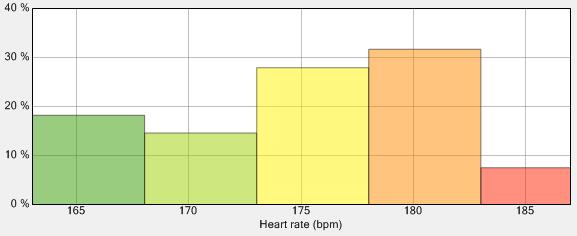
In the “split table” we have now set up the average heart rate for each split. You can also get a histogram to see your heart rate distribution during the race. This is interesting to compare from event to event. See an example below:
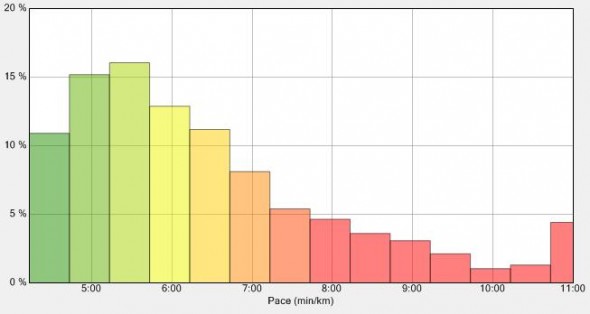
- Analysis of pace distribution. As for the heart rate histogram, you can also get a pace histogram. This is typically a curve which can be interesting to compare from race to race.
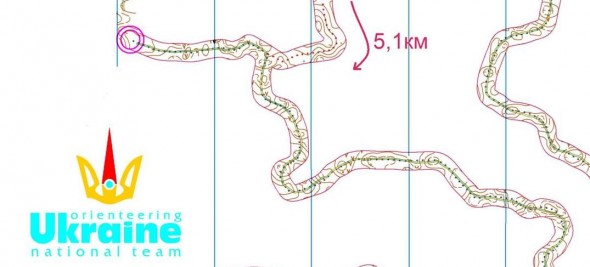
- Analysis of special technical trainings. GPS analysis lends itself very well to several types of o-technical exercises. You saw one example with the compass training exercise above. Another exercise is the corridor training exercise – an exercise which has become very popular as more and more runners have access to a GPS unit. With a GPS watch you can fully evaluate your corridor training, by identifying how often you had to step outside the corridor. Evaluation makes it more motivating to improve – use this actively in your training! See below for an example of a corridor training with GPS evaluation. You find some further exercises here in the o-training.net wiki.
- Analysis of map reading duration. Analysis of map reading duration is coming to QuickRoute in a later version.
- Make split times for different types of terrain in order to analyze your capabilities
- One type of pace increases to look for is stops to read the map
- GPS analysis is a good tool in order to analyse your control work
- Did you push too hard giving you too high heart rate ahead of a mistake?
Equipment for GPS analysis in orienteering
There are a lot of different GPS units which you can use – and most of them give you at least adequate GPS data for analysis. However, there are a few points which you should note,
If you choose a logger, there is significant difference in accuracy based on how you wear it
- GPS watches are more easy to use, but GPS watches are not allowed in World Ranking events. There you have to use equipment without display, sound signal and without any telecommunications module (i.e. you can not use a GPS tracker, only a logger).
- You can get very cheap GPS loggers – down to 40 Euro or below. Note however that some of the smallest one have a smaller antennae, and therefore give poorer results.
- If you choose a logger, there is significant difference in accuracy based on how you wear it. Keep it somewhere where you have as little body shadow as possible – your wrist is a good option.
- There is significant difference in accuracy for some of the GPS units out there. I give some comments about accuracy in the table below. The Garmin watches are known to all have fairly good accuracy.
- For best analysis results, use a GPS unit which logs your position every second (frequency of 1 Hz). This gives the best analysis, as it is possible to identify also small mistakes. Note that of the Garmin watches, only the Forerunner 305/205 and the new Forerunner 610 can log the position every second. The other Garmin GPS watches log your position with “smart recording”, which usually means every 3-6 seconds.
- It may be advantageous to also include the heart rate in your analysis. In this case you should probably use one of the watches which combine GPS data with pulse data (there is also a unit from FRWD which has this combination).
- In some cases you might also want to analyse your altitude variation. For this you need a GPS with built-in barometric altitude logging – or a separate altitude logging unit which logs altitude using barometric data. Altitude information from GPS data is generally not sufficiently accurate for analysis purposes in orienteering.
- Data from all GPS units can be coupled to a HeadCam analysis – and also to mapreading analysis with the proper units.
- You are going to use your GPS a lot – preferably for all high intensity orienteering technical training/competitions. Thus choose a GPS units which makes it possible to have a good “work flow”, i.e. an easy way to upload your GPS data to your computer, and get it ready for analysis in QuickRoute (or another piece of software of your choice).
Based on these considerations, I have set up a set of favourite GPS units for o-technical analysis. Shout in the comments if you don’t agree! The integration of reading from Garmin watches directly in QuickRoute does influence the choice of favourite equipment below. I have also added three different GPS loggers, as loggers are cheaper (possible to buy many for a club), and loggers are your only option for World Ranking events. There are A LOT of GPS logger out there, there might be better options than the one listed here (add a comment if you know about any better) – but the ones listed here are tested by myself or by other orienteers I know.
Table: My favourite GPS equipment for analysis in Orienteering
| Option 1: Garmin Forerunner 305 (or the 205 which is identical and without a heart rate monitor) Update 19/04/2012! These are unfortunately no longer produced – you might get lucky and get a leftover! |
Pros: One of the cheapest GPS watches, has 1 second recording, route can be directly read from QuickRoute. Accuracy similar to other Garmin watches. (see review) One of the cheapest GPS watches, has 1 second recording, route can be directly read from QuickRoute. Accuracy similar to other Garmin watches. (see review)
<tr>
<td><span>Garmin Forerunner 405/410/310 XT watches</span></td>
<td>Best tool</td>
</tr>
<tr>
<td><span>Garmin Forerunner 110/210 watches</span></td>
<td>Best tool</td>
</tr>
Cons: Quite big and bulky, especially for a woman. No wireless ANT+ technology (see below), i.e. you have to physically connect the watch to the computer via USB. Old technology. Not to be used at WRE events as all watches. |
| Option 2: Garmin Forerunner 310 XT watch – (or maybe 405/410) |
 Pros: The route is wirelessly transferred to computer when watch enters the room of the computer – can be directly opened in QuickRoute without connecting watch to computer/open other software. Watch is a bit bulky, but still quite compact and good to wear compared to the 305 (405/410 even more compact). Accuracy similar to other Garmin watches, and the 310XT even has 1 second recording mode with a firmware update. See review of 405 and 410 Pros: The route is wirelessly transferred to computer when watch enters the room of the computer – can be directly opened in QuickRoute without connecting watch to computer/open other software. Watch is a bit bulky, but still quite compact and good to wear compared to the 305 (405/410 even more compact). Accuracy similar to other Garmin watches, and the 310XT even has 1 second recording mode with a firmware update. See review of 405 and 410
Cons: The 310 XT might be a bit bulky. For the 405/410: The touch bezel is awkward to use, but this should be improved for the 410 + no 1 second recording mode. Not possible to turn off watch. Not to be used at WRE events as all watches. |
| Option 3: Garmin Forerunner 610 / Garmin 910XT (Updated April 2012) |
 Pros: Two very good options – both with 1 second recording. The 610 is an all-day watch whereas the 910XT is a watch to be used only for exercise (20 hour battery life). The 910XT has a barometer for altitude logging – thus has a lot more accurate altitude data then the other options. Pros: Two very good options – both with 1 second recording. The 610 is an all-day watch whereas the 910XT is a watch to be used only for exercise (20 hour battery life). The 910XT has a barometer for altitude logging – thus has a lot more accurate altitude data then the other options.Cons: Not to be used at WRE events as all watches. More expensive than the alternatives. |
| Option 4: igotU GPS logger |
 Pros: Very small and light (21 grams) – you can keep it in a headband/Buff during your run. Very cheap (40 Euro or even cheaper). 1 second recording mode. Allowed to be used at World Ranking Events. Possible to quickly transfer GPX-files to computer using MoTrack software (but still have to connect to USB to transfer) – also quick transfer if you have to administer many units. See review here. Pros: Very small and light (21 grams) – you can keep it in a headband/Buff during your run. Very cheap (40 Euro or even cheaper). 1 second recording mode. Allowed to be used at World Ranking Events. Possible to quickly transfer GPX-files to computer using MoTrack software (but still have to connect to USB to transfer) – also quick transfer if you have to administer many units. See review here.
Cons: Accuracy is significantly poorer than the Garmin watches (you get best accuracy by fastening the GPS unit on your wrist like a watch or by carrying it on your head in a buff/headband, but still a bit from the Garmin watch accuracy). See accuracy comparison sample here. When you loose accuracy, you get track points which are far off, giving you strange spikes and problems with the analysis. Transfer is not directly integrated in QuickRoute (but you can easily export GPX-files which can be imported in QuickRoute). |
| Option 5: Globalsat BT 335 logger |
 Pros: Many of the same Pros as for the igotU logger, but it is a bit heavier and a bit more expensive. However, the accuracy is superior (see accuracy sample here) – accuracy is approximately as for the Garmin watches. See info about the BT-335 here.Cons: Transfer process to the computer is more awkward (you need to use Bluetooth, i.e. you need a computer with Bluetooth), in my experience with this unit it was not easy to set up transfer from many units. Pros: Many of the same Pros as for the igotU logger, but it is a bit heavier and a bit more expensive. However, the accuracy is superior (see accuracy sample here) – accuracy is approximately as for the Garmin watches. See info about the BT-335 here.Cons: Transfer process to the computer is more awkward (you need to use Bluetooth, i.e. you need a computer with Bluetooth), in my experience with this unit it was not easy to set up transfer from many units.Note! This might be an outgoing model, so there might be a new model with this high accuracy which I am not aware of (mine is several years old). It is available here. There is also the DG 200 USB logger from Globalsat which is a bit bigger but should give similar results to the BT 335 and maybe easier transfer to computer. |
| Option 6: Photomate 887 Lite |
 Pros: Very small and light (18 grams). Similar advantages as for the igotU GPS unit, but accuracy is said to be somewhat better (from personal communication, no data to show you for now). Seems to be available online for as low as $30-40. Pros: Very small and light (18 grams). Similar advantages as for the igotU GPS unit, but accuracy is said to be somewhat better (from personal communication, no data to show you for now). Seems to be available online for as low as $30-40.
Cons: Accuracy poorer than Garmin watches and BT 335. I have not personally checked workflow for transferring GPS data to computer, but as far as I have heard it should be possible to be up in QuickRoute in “minutes” using e.g. the BT747 software. |
In addition to the watches/units in the table above, there are a lot of other options. Some of these are listed in the table below along with some short comments.
Table: Overview of other GPS units.
| Garmin Forerunner 110/210 watches | The Garmin 110/210 watches are the new “simpler” GPS watches from Garmin. Accuracy should be approximately the same as for the other Garmin watches. However, they do not use ANT+ technology for wireless transfer to the computer, and you can not use them directly in QuickRoute (to my knowledge). Instead you have to make a GPX-file using the bundled software (it comes in the new Garmin FIT-format), and import this GPX-file in QuickRoute. See review of Garmin Forerunner 210 and Forerunner 110. If orienteering is not your main use for the GPS watch, and you want to use your GPS watch as a day-to-day watch in addition, a Forerunner 110 or 210 might be your best option. |
| Polar GPS watches | Polar has a separate GPS unit for their pulse watch. |
| Nike GPS watch | Nike has a new GPS watch which looks nice on paper. However, I would not recommend this for orienteering use as you need to have an internet connection to transfer data from the watch to the computer – and the transfer is done via the Nike servers. |
| Timex GPS watch | Timex has a GPS watch which I would not recommend over the Garmin watches – there is also no direct integration in QuickRoute. I have not tried this watch. |
| Suunto GPS watch | Suunto has some GPS watches which should perform quite well. I have not tested any of these though, and there is no direct integration in QuickRoute. |
| Globalsat GPS watches | Globalsat has several GPS watches. These are often cheaper than the Garmin’s, and said to work quite well. I’d rather take a Garmin though due to the direct import in QuickRoute. |
| Holux M 1200E logger | Quite cheap at DealExtreme. Not the best accuracy, but decent relative accuracy (seems to be a bit better than igotU?) See accuracy sample here. Could maybe recommend this one. |
| Qstarz BT-1300S logger | Accuracy seems to be not the best. The older BT 1000 is a bit better (but bigger). |
| Mobile phone | You can store your GPS track using an iPhone, Android phone, WM phone, Nokia phone etc. as well. There are a lot of different GPS logger applications for the different mobile platforms, and it is not difficult to find one which can export GPX-files. However, the phones usually gives you less accurate GPS tracks than the dedicated loggers, and the phones are also heavier. It is, however, possible to use a mobile phone as a first test before you buy a dedicated unit. |
Software for GPS analysis in orienteering
Although QuickRoute is probably the best available option for orienteering analysis for a single GPS track, I list some of the alternative available software alternatives below along with some strengths/weaknesses for completeness. Note that most software alternatives listed here assume that you are on windows, except for the browser and/or java based.
Table: GPS Analysis for Orienteering: Software overview
| QuickRoute | Covered above. Best tool for analysis of a single GPS track (see QuickRoute webpage and QuickRoute source code) |
| 3DRerun | Still in closed beta, but you can get access by sending an email to 3drerunbeta@worldofo.com. Has some nice replay functionality, but its advantage is mostly for analysis of several runners or for HeadCam video analysis. (see 3DRerun website – password required) |
| GPSseuranta | GPSSeuranta is the “state of the art” tool for GPS tracking within orienteering – being used in a lot of orienteering competitions. Recently GPSSeuranta has also started selling license for a special version of GPSSeuranta for post-race analysis by upload of GPX-files. For analysis of a single runners GPS-track, I would still recommend QuickRoute. See GPSseuranta website. |
| RouteGadget | Nice replay functionality. Geared towards analysis of many runners from a competition. In theory possible to set up for analyzing a competition/training for one runner only, but quite complicated (see RouteGadget website) |
| RunOway | Geared towards analysis of many runners from a competition. Used extensively in Sweden (see RunOway website) |
| Mapandcoach | Should give you some possibilities to analyze GPS data – similarly to RunOway, but I have not had the chance to see it in action yet. Is going to work together with RunOway in 2011 (see Mapandcoach website) |
| SportTracks | The software SportTracks has been used for analysis of GPS tracks for orienteering by some runners for comparison of several routes/runners. |
| OCAD | Some have used OCAD for overlaying their GPS route on the map, but this is not a very effective tool compared to e.g. QuickRoute. |
| OTrack | Similar tool to QuickRoute, but much less possibilities (see OTrack webpage) |
| OGPS | Similar tool to QuickRoute, but much less possibilities (see OGPS webpage). |
| MoTrack | Some of the properties of QuickRoute – geared towards comparing several routes. Not as userfriendly as QuickRoute. I’ve used it mostly to transfer data from igotU units (see MoTrack website here, Norwegian only) |
Reources for GPS analysis of orienteering activities
Other resources related to GPS analysis of orienteering activities:
- Presentation: GPS-analysis: Revolution for analysis of technique in the sport of Orienteering (by Jan Kocbach, presented at the Norwgian “Olympiatoppen” Research conference 2011)
- Presentation: GPS – a tool to get a better orienteer (Swedish text) (by Mats Troeng and Peter Öberg)